
Hello Learners! Today we will explain all things about what is MS Excel with its Features and uses; as well as Excel Formulas List with Examples and their functions. This is article over the Internet; so after reading this content; you will definitely fully aware about MS Excel Features and Formulas without getting any obstacle.
What is MS Excel?
Definition: Microsoft Excel is a powerful spreadsheet program that designed by Microsoft. It is capable to organize data into columns and rows that allowing users to execute mathematical functions create visuals and graphs and manage and analyse data efficiently.
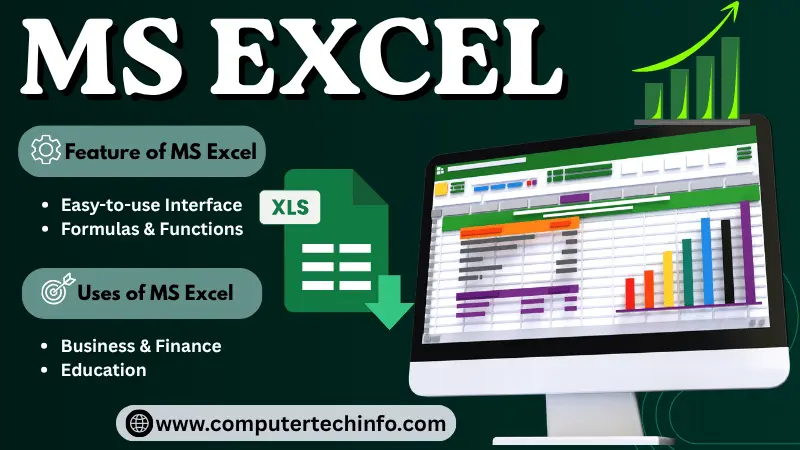
Today MS Excel is widely going to use for getting to analysis, data entry, data management, accounting and budgeting. Excel is most compatible with operating systems such as Windows, macOS, Android and iOS; making it accessible across different platforms
History of MS Excel
Here’s a brief overview of the history of Microsoft Excel:
• 1982–1985: Microsoft began work on a spreadsheet program called Multiplan. Multiplan later became the base for Microsoft Excel.
• 1985: Microsoft Excel 1.0 was released for Apple Macintosh computers.
• 1987: Microsoft Excel 2.0 published for Windows. Microsoft Excel 2.0 authorized windows users to cooperate with spreadsheets.
• 1990: Microsoft Excel 3.0 introduced new features. It disclosed new toolbar buttons and included assistance for OLE.
• 1992: Microsoft Excel 4.0 establishing VBA. It assists users mechanize tasks and create custom programs.
• 1993: Microsoft Excel 5.0 added functions and refine charting and data presentation.
• 1995: Microsoft Excel 95 (Version 7.0) launched with an interface. It added AutoFilter and conditional formatting.
• 1997: Excel 97 (8.0) Appended PivotTables. Gave better tools for working together.
• 1999: Excel 2000 (9.0) increased the Office Clipboard. Made its data analysis tools stronger.
• 2001: Excel 2002/XP (10.0) improved how smart tags worked. Gave better tools, for analyzing data.
• 2003: Excel 2003 (11.0) it indented on working together. Introduced List Commands and List Objects.
• 2007: Excel 2007 (Version 12.0) carried a upgraded Ribbon interface. It also allowed rows and columns than before giving users more space, for data.
• 2010: And this Excel 2010 (14.0) introduced Sparkline’s and the Power Pivot add-in.
• 2013: Excel 2013 (version 15.0) Originated apps for Office and refined this version for data modelling attributes.
• 2015: Excel 2016 (16.0) added chart types and made teamwork greater.
• 2018 onward: And this Excel joined Microsoft 365. This move created a subscription model that deliver users updates and new features.
• 2021: Excel 2021 keep working within the Microsoft 365 eco-friendly system. It continued to receive feature updates and improvements.
I see that this version shaped by the features and capabilities available in Microsoft Excel from 2003 to 2024.
Features of Excel 2003
• This discharge featured the WIMP connection meaning Windows, Icons, Menus, Pointer. This interface had drop‑down menus and icons, at the top of the screen.
Also Read: Windows 11: Features, Benefits, Advantages and Disadvantages
• It was the version to introduce the Tables feature allowing users to organize and analyze data more effectively.
• This Mac version was disclosed in 2004.
Features of Excel 2007
Ribbon System: Replaced the menus and toolbars providing a more intuitive and efficient way to access Excel’s features and functionalities.
Themes and Styles: Introduced themes and styles that surpassed the AutoFormat Table feature allowing for the creation of looking spreadsheets with unified color schemes and predefined formats based on the chosen theme.
Improved Charts and Graphs: Charts were improved with options, a neater look and the ability to copy-paste charts into Microsoft Word or PowerPoint.
Enhanced Sorting and Filtering: Added the ability to sort information by color, filter by color or dates select items to filter and filter data in PivotTables. The limits on how many filters could be using concurrently were increased from 3 to 64.
New File Formats: Introduced XML-based file formats, known as the Microsoft Office Open XML formats for Word, Excel and PowerPoint facilitating integration with data sources.
Features of Excel 2010
I appreciated the new formatting tools of Microsoft Excel 2010 offered new features and enhancements like:
Also Read: Fedora vs Ubuntu: Which One Should You Choose?
Sparklines: Introduced charts, inside cells making it ease for users to see how data changes over time.
Slicers: Introduced a way for users to filter information in PivotTables helping them look at and organize large amounts of data more easily.
Enhanced Tables and Filters: Excel made its table and filter options better, which is arrange and find certain data. Options include sorting by color filtering by color, selecting items and filtering PivotTable data.
Paste Preview: This feature lets users see how information will look before they paste it into a worksheet.
Improved Conditional Formatting: Excel gave formatting choices. Options include data bars, color scales and icon sets to make important data easier to identify.
Customizable Ribbon: Users could personalize the Ribbon. They could create their tabs and groups with the commands they used most often.
Features of Excel 2013
Start Screen: I see the worksheets I opened recently. It also lets them open files saved on their computer or in the cloud
Also Read: Advantages and Disadvantages of Ubuntu | Feature & Benefits
Flash Fill: I Mind the patterns, in the data and as a short time then fills in the rest of the cells automatically.
Slicers: I use Slicers to filter info easily so I can look at and break down the data sets in hurry.
Quick Analysis Tool: A tool that lets users convert data into a chart or table in two steps or less with preview options for conditional formatting, spark lines or charts.
Recommended Charts and PivotTables: Tools that make tasks easier to perform with recommended charts and pivot tables based on the data.
Chart Formatting: Chart formatting improved with options such as chart elements, chart styles and chart filters.
Features of Excel 2019
• Data Import Tool Improvements: The Power inquiry data bring in feature, which was known as Get & Transform in Excel 2016 went back to the name Power Query in Excel 2019. The tool was also improved with features.
Also Read: Advantages and Disadvantages of iOS | Features & Benefits
• Excel 2019 improves map charts. Map charts now support data types. Excel 2019 also lets users customize the colour scale.
• Excel 2019 offers, than 500 built-in SVG‑compliant icons. These icons help users create professional‑looking spreadsheets.
• Improved Accessibility: Excel 2019 made for users it is easier to use by improving screen reader support. Even it adding keyboard shortcuts for navigating the Ribbon.
Features of Excel 2021
Dynamic Arrays: Excel 2021 defines arrays, allow them for more flexible and definitive proof Scheming.
Automatic Data Analysis and Natural Language Queries: These features enable users to perform data analysis and use natural language queries to interact with their data.
Linked Data Types: Excel 2021 expanded support, for Linked Data Types giving users ways to work with data that connected to external sources.
Custom Data Types: Excel 2021 define custom data types allowing users to define their data types for more effective data management.
2022 Features of Excel
• Dynamic 14 New functions for text and arrays were included.
MS Excel Uses & Examples
Microsoft Excel is extensively using in industries and professional fields because of Microsoft Excels adaptable and strong qualities. Usually Microsoft Excel are:
Also Read: Advantages and Disadvantages of macOS | Features & Benefits
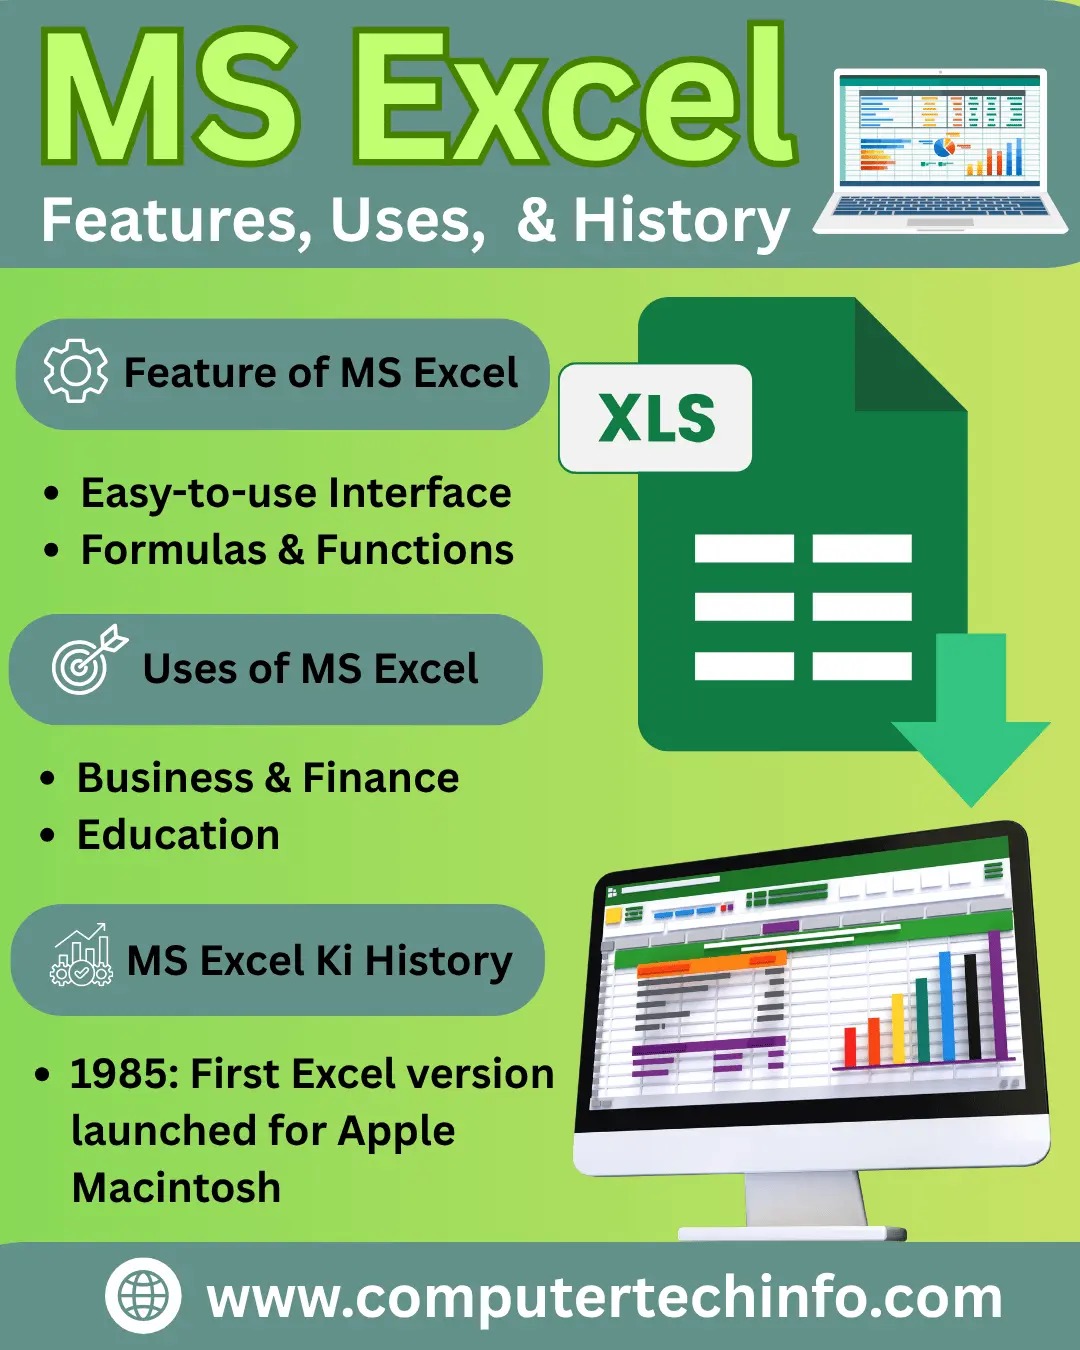
• Data Entry and Storage: Microsoft Excel works like a daybook where users can enter arrange and store information, in cells arranged across rows and columns.
Example: Entering sales figures, physical list levels or survey responses.
• Data Visualization: Excel provides tools for analysing data creating charts, graphs and pivot tables to represent trends and patterns.
Example: Analysing sales trends over time using a line chart or creating a pie chart to show the distribution of expenses.
• Financial Management: Excel is widely using for planning, financial planning and performing financial calculations.
Example: Creating a budget calculating loan repayments or projecting future earnings.
• Mathematical and Statistical Calculations: Excel includes a range of statistical functions for performing calculations.
Example: Calculating averages, deviations or using curve fitting for predicting trends.
Also Read: Windows Operating System: Features, Advantages and Disadvantages
• Project Management: Excel can help users plan projects organize tasks monitor progress and allocate resources.
Example: Creating a Gantt chart to display project schedules or assigning resources to project activities.
• Inventory Management: Excel aids in tracking inventory levels managing stock and generating reports for analysis.
Example: generate an inventory spreadsheet to monitor stock levels and Purchasing More Supplies.
• Task Tracking and To-Do Lists: Excel is employed for generating task lists tracking progress and managing deadlines.
Example: Developing a project task list with assigned deadlines and completion status.
• Customer Management: Excel can be using to organize customer records contact details and other client-related information in a format.
Example: Maintaining customer records that include contact details and previous purchase information.
• Time Tracking: Excel can help users record working hours and prepare timesheets making it useful, for businesses that charge clients according to the time spent on tasks.
Example: Building an employee database that includes employee contact details employee job positions and employee performance information.
• Educational Purposes: Excel is useful for activities helping students and teachers work with subjects, like mathematics, statistics and business.
Example: Creating an employee database with details such as contact information, job roles and performance metrics.
• Educational Purposes: Excel is going to use in settings, for teaching and learning various subjects, including mathematics, statistics and business studies.
Example: Making spreadsheets for students to practice math problems or look at data for research projects.
• Scientific Research: Excel also can be using for handling and looking at data writing down experiments and making charts.
Example: Writing down. Looking at data from a science experiment or research project.
• Healthcare Data Management: For writing down patient data, managing records and looking at health statistics.
Example: Making a spreadsheet to track appointments, medical history and treatment plans.
• Quality. Assurance: Excel helps in checking and keeping quality standards writing down test results and looking at quality data.
Example: Keeping track of product problems doing quality checks and making control charts.
• Supply Chain Management: For tracking and looking at supply chain data, managing logistics and making inventory better.
Example: Making a dashboard to watch inventory levels, shipments and how suppliers are doing.
• Statistical. Research: Excel is used for doing analysis testing ideas and doing research studies.
Example: Looking at survey data doing regression analysis or using statistics on experiment results.
• Real Estate Analysis: Excel is used for looking at property values making mortgage plans and managing real estate investments.
Example: Making models to look at how money a property will return.
• Risk Management: Excel helps in looking at and managing risks making risk models and looking at risk factors.
Example: Making a risk assessment chart calculating how risk there is and making plans to reduce risk.
Also Read: UNIX Architecture Diagram with Components and Its Functions!
• Event Planning: Excel helps in planning and managing events tracking money and managing guest lists.
Example: Making a spreadsheet for an event budget tracking costs and managing who is coming.
• Legal Case Management: Excel is used for managing cases tracking details and looking at legal data.
Example: Making a spreadsheet to track the status of a case, court. Legal costs.
• Personal Finance: For managing money including making budgets tracking spending and looking at investments.
Example: Making a budget spreadsheet tracking money coming in and going out and looking at how money’s spent.
• Data Import and Export: Excel lets people bring in data from places helping to connect data together.
Example: Bringing data from databases text files or online sources to use in Excel.
• Automation and Workflow Optimization: Excel lets people do repeated tasks automatically by making and using macros making work faster.
Example: Automating the cleaning of data, repeated math or creating reports.
FAQs (Frequently Asked Questions)
Final Words
Now we can hope that you have learned everything about what’s MS Excel with its Features and uses; As well as Excel Formulas List with Examples and their functions.
If this article is valuable for you, then please share it along with your friends, family members, pet lovers or relatives over social media platforms like as Facebook, Instagram, LinkedIn,X, and more.
Do you have any experience, tips, tricks, or query regarding on this? You can drop a comment!
Have a Nice Day!


